2022 Marketing Statistics Every Brand Must Know to Win
Are you searching for the latest social media and marketing statistics? Digital marketing stats? Or want to know the latest trends in lead generation and marketing? If so, we have some fascinating statistics for you.
You see within every data point hidden below the surface; there is a story. Within every statistic hides an opportunity for the advanced marketer or business leader.
By analysing the below statistics, you will discover what your competition and the market is doing. When you know what the market is doing, you can identify gaps to accelerate your brand, drive more leads, and increase the revenue of your business.
To illustrate this point, I will analyse a couple of statistics for you.
Let's use conversion rate optimisation as our first example (CRO). Now for many of you reading this blog, you would undoubtedly be familiar with A/B testing. Did you know that in 2020 as little as only 17% of the market was using A/B testing to improve conversions on their landing pages?
Now, if you're currently using A/B testing on your landing pages, you are already leading the market. It does not matter whether you are a B2C business or a B2B business. By simply using A/B testing, you can make a landing page that is converting at 10% all the way through to 40/45%.
Now, suppose that the landing page generates $5,000 in revenue per month for other business or e-commerce businesses. In that case, you have materially and measurably improved revenue by 400%, taking $5,000 per month to $25,000.
Not only have you improved your revenue line, but you have also reduced your competition's market share. So should you not be using A/B testing on your landing pages, it's probably time to start.
Now I know I have painted an extreme position above, but I have done so to illustrate the point. Without A/B testing, you will never know how far you can improve your situation. And without knowing how far you can improve your position, you will never truly reach your company or organisations potential.
This is only one example of hundreds of possibilities. You see, statistics talk about the past what is occurred last year, last quarter and or last month. We live in a period where data, artificial intelligence, and new ways to reach our clients are appearing all the time.
As a point of reference to the above example, we are now using artificial intelligence to test 5 different landing pages at once. This places some of our clients with a significant advantage over their competition and in their market.
Having said this, we are going to break down the following statistics into seven key areas. Those areas are as follows:
- Advertising
- Content Marketing
- Search Engine Optimisation
- Lead Generation
- Email Marketing
- Social Media
- Video Marketing
Advertising
If ever there was an area that you need to get right or understand what your competition was doing, then it's this one. The difference between a high-quality ad and a low-quality ad can be the difference between paying $6 per click, up to $1,090 per click.
As the below statistics demonstrate, competition amongst advertisers is fierce. Video advertising is on the rise, and ad placement and audience targeting are the top marketing tactics used by marketers in 2020.
Video Advertising Statistics
- Businesses typically earn $2 for every $1 spent on Google Ads. (Google Economic Impact, Wordstream)
- "95% of video marketers say video has helped increase user understanding of their product or service."
(Wyzowl, 2019) - "92% of marketers surveyed who use video say that it’s an important part of their marketing strategy."
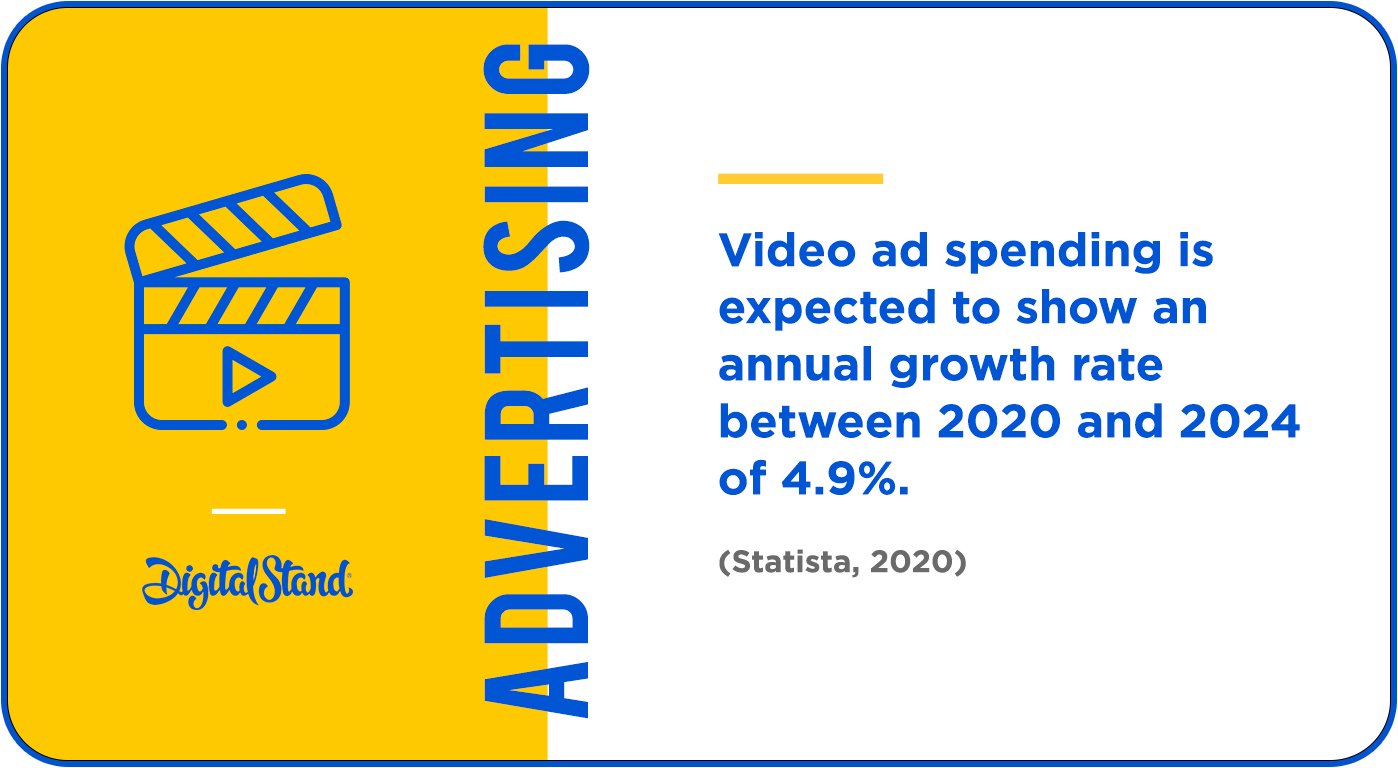
(Wyzowl, 2019) - "Video ad spending is expected to show an annual growth rate between 2020 and 2024 of 4.9%."
(Statista, 2020) - An overwhelming majority of people (94%) report watching explainer videos to learn more about a product, with 84% being swayed to make a purchase.
(Wyzowl, 2021)
PPC Advertising Statistics (Pay-Per-Click)
- The average click-through rate for Google ads is 3.17%. (WordStream)
- The average cost-per-click (CPC) in the software industry is $3.80 and the most expensive software industry keyword CPC is $95. (HubSpot via Ahrefs and WordStream)
- Paid search accounts for 39% of marketers’ budgets. (Marin Software)
- The average cost-per-click (CPC) in the marketing industry is $3.33 and the most expensive marketing industry keyword CPC is $165. (HubSpot via Ahrefs and WordStream)
- The average cost-per-click (CPC) in the medical industry is $2.62 and the most expensive medical industry keyword CPC is $90. (HubSpot via Ahrefs and WordStream)
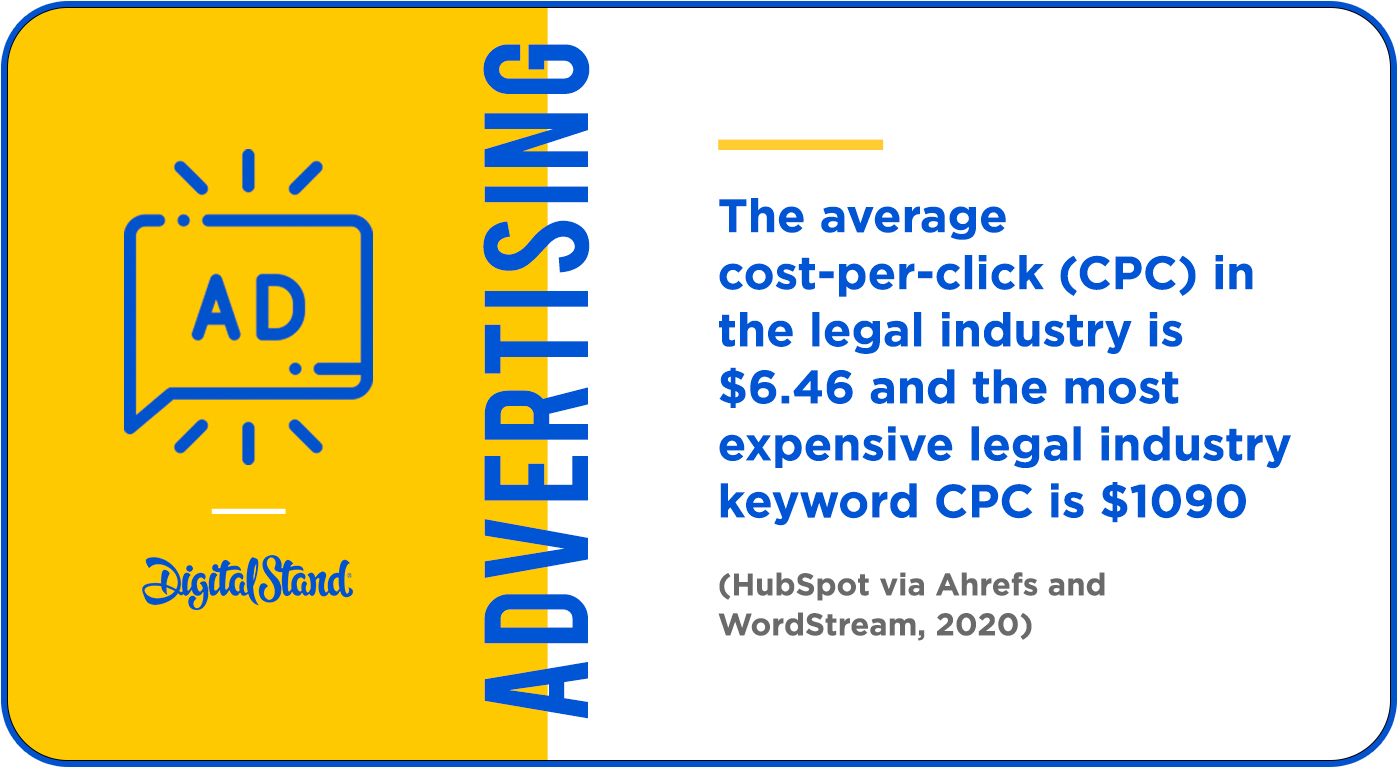
- The average cost-per-click (CPC) in the legal industry is $6.46 and the most expensive legal industry keyword CPC is $1090. (HubSpot via Ahrefs and WordStream)
- By using Google Ads for its mobile advertising, Williams Sonoma has seen a 70% increase in mobile sales.
(Google) - 94% of Facebook's advertising revenue is generated via mobile. (Statista)
Mobile Advertising Statistics
- 94% of Facebook's advertising revenue is generated via mobile. (Statista)
- In 2019 the U.S. was the largest global market based on mobile advertising spending.
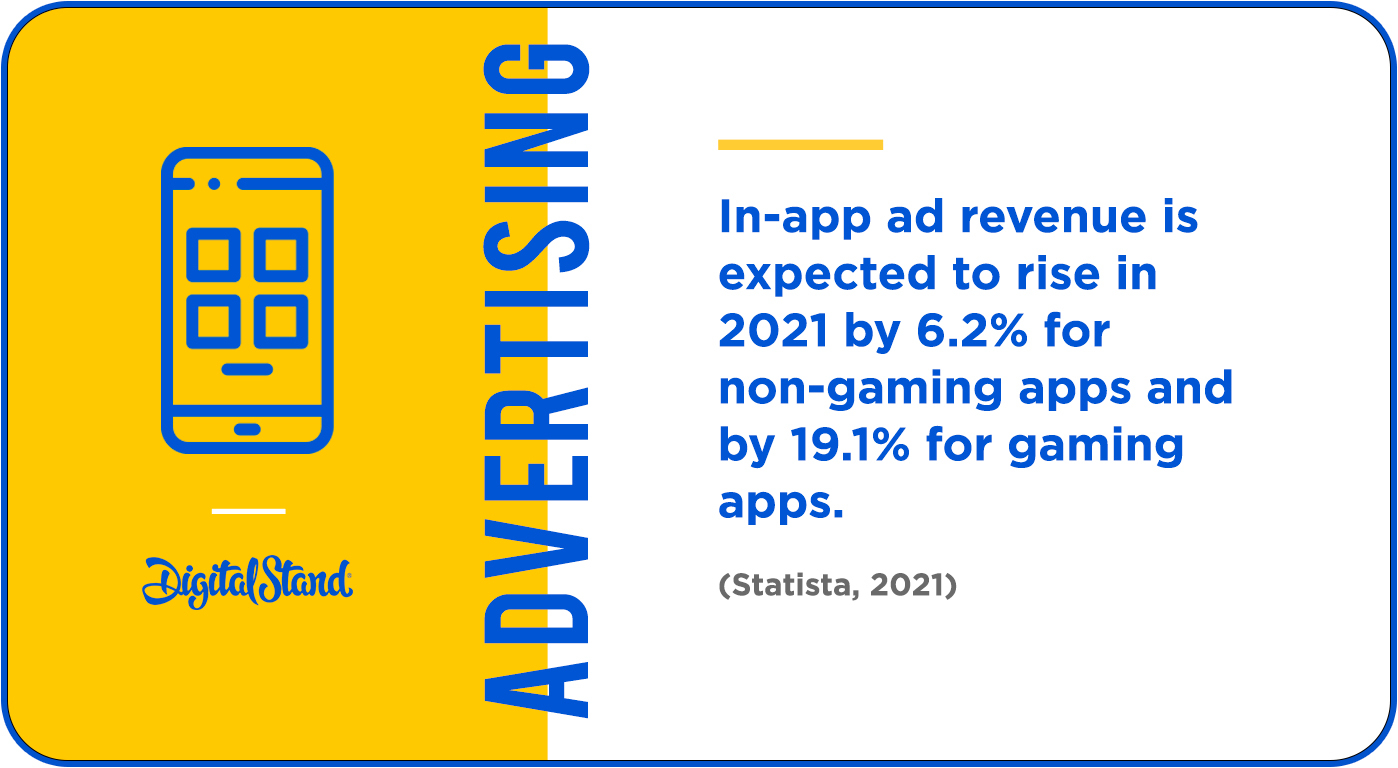
(Statista) - In-app ad revenue is expected to rise in 2021 by 6.2% for non-gaming apps and by 19.1% for gaming apps.
(Statista) - It is anticipated that Mobile advertising will exceed $240 billion dollars in 2022. (Statista)
- In January 2021, there were 4.32 billion mobile internet users. (Gotcha)
- In 2019, the U.S. was the largest global market based on mobile advertising spending, with China in second.
(Statista) - Mobile advertising spending is expected to surpass $240 billion dollars by 2022. (Statista)
- Mobile advertising has been rapidly growing in the past couple of years but is expected to slow down to about 10.4% by the end of 2022. (Google)
General Advertising Statistics
- 33% of marketers use paid advertising to increase their brand awareness. (HubSpot)
- Ad placement and audience targeting are the top optimization tactics used by advertisers today.
(HubSpot) - Fewer people use ad blockers in 2020 (41%) than four years ago, in 2016 (52%). (Audience Project)
Content Marketing
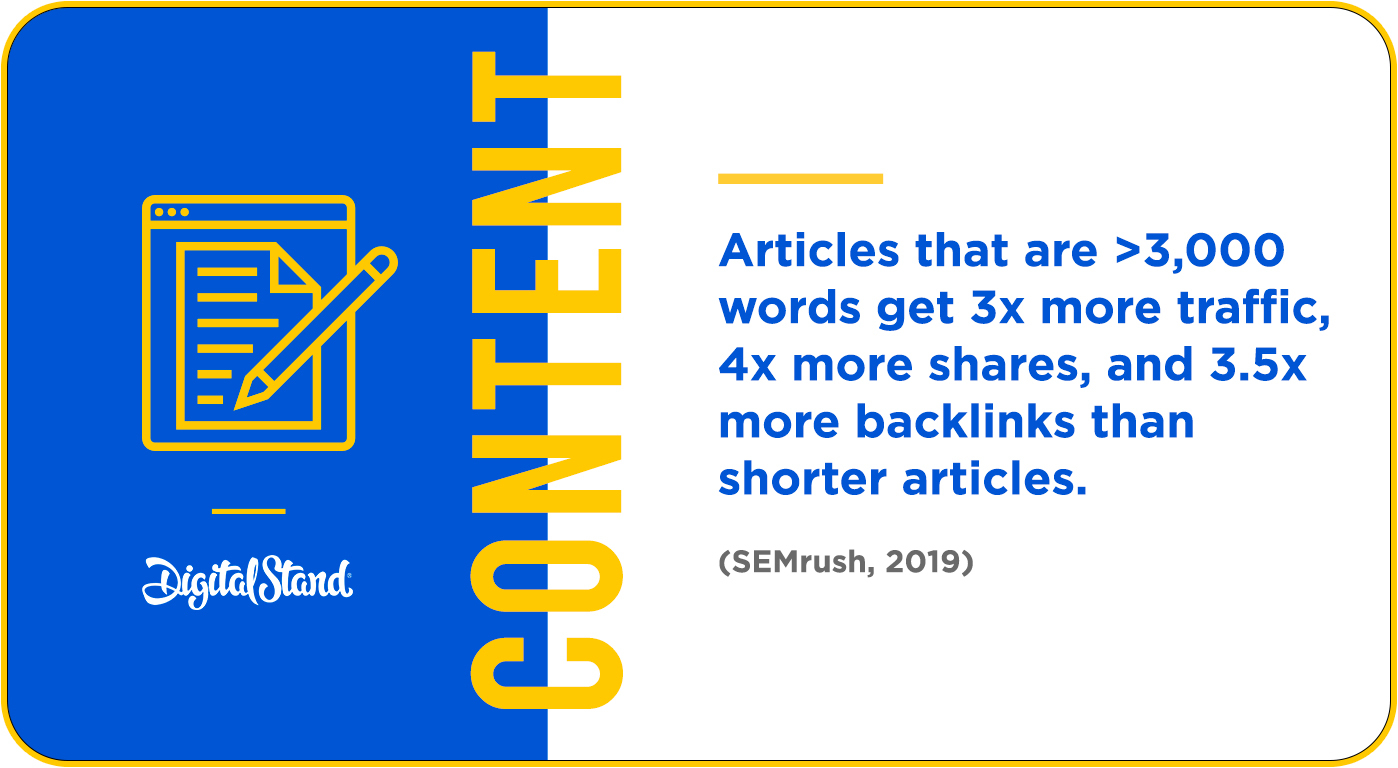
So here's an interesting statistic for considering. Articles over 3000 words get 3x more engagement, 4x more shares and 3.5 times more backlinks than shorter articles (SEMrush).
When you are putting together your next article, it might be worth considering the quality of the article and the length of the article. Any content marketer investing time in creating an article of this length also develops an article of high quality. So there is a correlation between length, quality and engagement.
Consequently, this will increase your dwell time on your website. The number of times people view your content. Which in turn has a positive impact on your SEO.
So there's an inherent benefit to high-quality long-form content creation. Not only will your audience appreciate it, but it will have a short term and longer-term benefit to your website.
- 60% of marketers measure their content marketing success through sales.
- As of 2019, a survey of bloggers found that 32% of respondents always checked the analytics of their blog posts. (Statista)
- The average blog post contains 1269 words (Orbit Media)
- Websites that have a blog attract 55% more traffic (Quick Sprout)
- Blogs are among the primary three forms of media used in content strategies today. (Hubspot)
- 83% of traffic to marketing blogs comes from desktops. (SEMrush)
- Search is the number one traffic source to blogs across all industries. (SEMrush)
- In the marketing industry, the top-performing articles are over 5,700 words in length. (SEMrush)
- Articles that are less than 3,000 words rank 3rd in B2B content assets that generate the best results (Content Marketing Institute, 2021)
- Articles that are >3,000 words get 3x more traffic, 4x more shares, and 3.5x more backlinks than shorter articles. (SEMrush)
- Listicles get 2x more shares than other blog post formats. (SEMrush)
- 51% of companies say updating old content has proven the most efficient tactic implemented. (SEMrush)
- The majority of companies (67%) use organic traffic to measure their content success. (SEMrush)
- Video has become the most commonly used format in content marketing, overtaking blogs and infographics.
(HubSpot, 2020) - Of the 48% of companies that use a content marketing strategy they leverage blogging (HubSpot)
- 87% of video marketers say that video has increased traffic to their website. (Wyzowl)
- 80% of video marketers claim that video has directly increased sales. (Wyzowl)
- 78% of companies have a team of one to three content specialists. (SEMrush)
- Web traffic is among the top two most common measurements of success for content marketing strategies. (HubSpot)
- The most common measurement of success for content marketing programs is Total Sales. (HubSpot)
- Marketers today create content for multiple audience segments — marketing to three audience segments is most common. (HubSpot)
- "Content Marketing Strategy" is the most searched query related to content marketing. (SEMrush)
- 94% of marketers use social media for content distribution. (SEMrush)
- 75% of Americans age 12+ (approximately 212 million people) are now familiar with podcasting.
(Edison Research)
Search Engine Optimisation
Did you know, according to HubSpot, only 64% of marketers invest time in doing search engine optimisation? This means that 36% of marketers are not doing any search optimisation at all!
We estimate that approximately 60% are not sure how to optimise their environments for brands doing SEO. Disagree? Think about this, only 10 brands can be on the 1st page of Google for a chosen keyword.
SEO is complex and is a science and will include pillar pages, subtopics, and thought leadership pieces.
Now, if you're reading this and you don't know what a pillar page is, click the hyperlink to see a few examples.
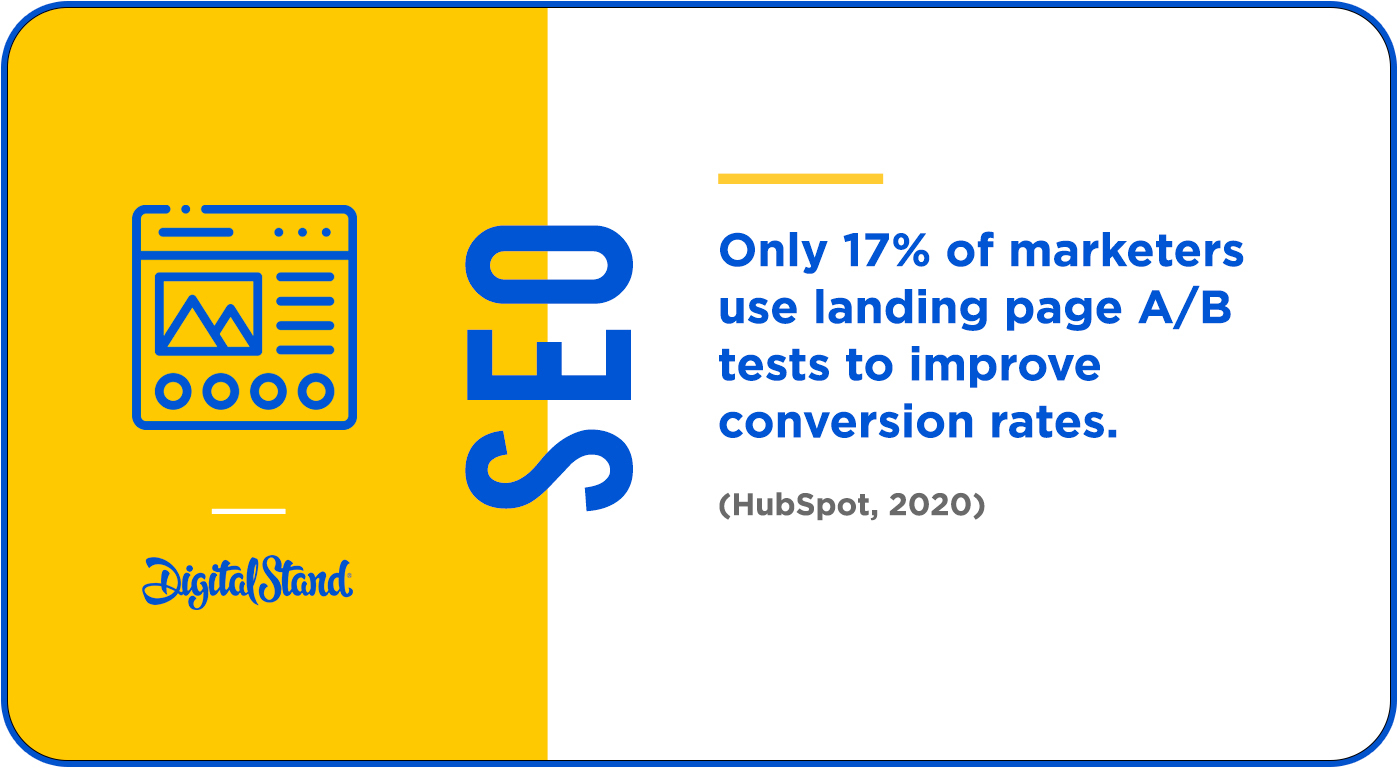
- Only 17% of marketers use landing page A/B tests to improve conversion rates. (HubSpot)
- More than 50% of marketers identify keyword rankings and organic traffic as the top way to measure the success of their SEO strategy. (HubSpot)
- The first five seconds of page-load time have the highest impact on conversion rates. Website conversion rates drop by an average of 4.42% with each additional second of load time. (Portent)
- 69% of marketing professionals invest in SEO. (HubSpot)
- In a survey conducted by Databox, 70% of respondents said that SEO is better than PPC for generating sales. (Databox)
- Landing pages, the least popular type of signup form, have the highest conversion rate (23%). On the other hand, popups, the most popular signup form, have the second-lowest conversion rate (3%). (Omnisend)
- Global B2C e-commerce sales are expected to reach $4.5 trillion by 2021. (Shopify Plus)
- 51% of shoppers surveyed say they use Google to research a purchase they plan to make online. (Think with Google)
- According to a 2019 study, search traffic generated 65% of total e-commerce sessions, 33% was generated through organic search, and 32% was generated through paid search. (Statista)
- 59% of shoppers surveyed say that being able to shop on mobile is important when deciding which brand or retailer to buy from. (Think with Google)
- Over a two year period, there was a 900%+ growth in mobile searches for “___ near me today/tonight." (Think with Google)
- 60% of smartphone users have contacted a business directly using the search results such as the "click to call” option. (Think with Google)
- 46% of shoppers surveyed confirm inventory online before going to a store. (Think with Google)
- 70% of shoppers surveyed say the ability to shop in-person/ in a store is important when deciding which brand or retailer to buy from. (Think with Google)
- As of 2019, mobile devices, excluding tablets, generated about half of all website traffic globally.
(Statista) - Mobile web traffic has consistently accounted for about half of all global web traffic since the beginning of 2017. (Statista)
- 87% of internet users in the U.S. use more than one device when going online. (Think with Google)
- 60% of smartphone users have contacted a business directly using the search results (e.g. "click to call" option). (Think with Google)
- Almost 25% of companies invest in mobile optimization as a top SEO tactic. (HubSpot)
- 39% of smartphone users are more likely to browse or shop a company or brand’s mobile app because it’s easier or faster to make a purchase. (Think with Google)
- About 64% of marketers actively invest time in search engine optimization (SEO). (HubSpot)
- Text will always be the foundation of search so making sure the text around your website's assets is descriptive will help them rank well in search. (HubSpot)
- In 2020, SEO reports will tie initiatives to outcomes, such as showing the impact of SEO on broader business goals. (HubSpot)
- To improve site performance, the top technical SEO tactic used by marketers is optimizing mobile performance. (HubSpot)
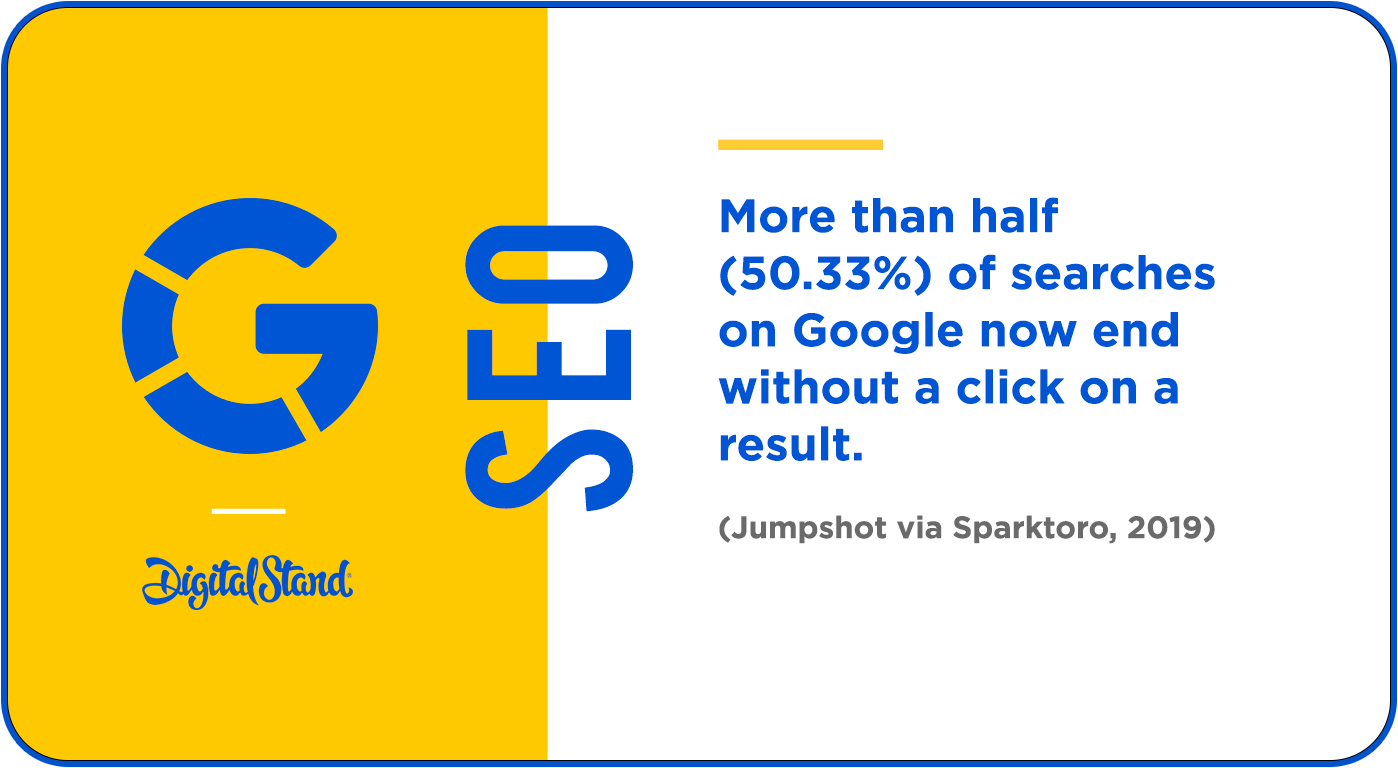
- More than half (50.33%) of searches on Google now end without a click on a result. (Jumpshot via Sparktoro)
- As of June 2019, 94% of internet searches happen on a Google property. (Jumpshot via Sparktoro)
- Google uses 810 unique SERP features. Of those, 161 are found on more than 0.2% of keywords. (seoClarity)
- 65% of 25-49 year old’s speak to their voice-enabled devices at least once a day. (PWC)
- OC&C estimates that $40 billion in the U.S. and $5 billion in the U.K. will be spent through voice commerce by 2022. (OC&C Strategy Consultants)
- Mobile optimisation has been autoauddeemed to be effective by over 64% of marketers. (HubSpot)
Lead Generation
As you will note below in one of the statistics, the number one priority marketers reported in 2020 was generating leads. We don't anticipate that this will change at all in 2021.
But here is something to think about. Over 60% of marketers said their CAC (cost of customer acquisition) has increased. But only 17% A/B test landing pages???
According to "Activate", ad placement and targeting are the top 2 tactics advertisers currently use to drive more demand.
Marketers who use data to understand their client base, demographics, and pains point already hold an advantage, rather than assuming that they know them and building a campaign in that context.
Putting the right ad in front of the right audience at the right time is going to yield the right results — every time.
I would almost go as far as to say that targeting and ad placement is more important than the creative. I do not, however, want to understate the importance of the creative. However, using data to identify your audience and their needs take priority before building the creative.
In 2021 never assume what your audience is looking for; build your case through data.
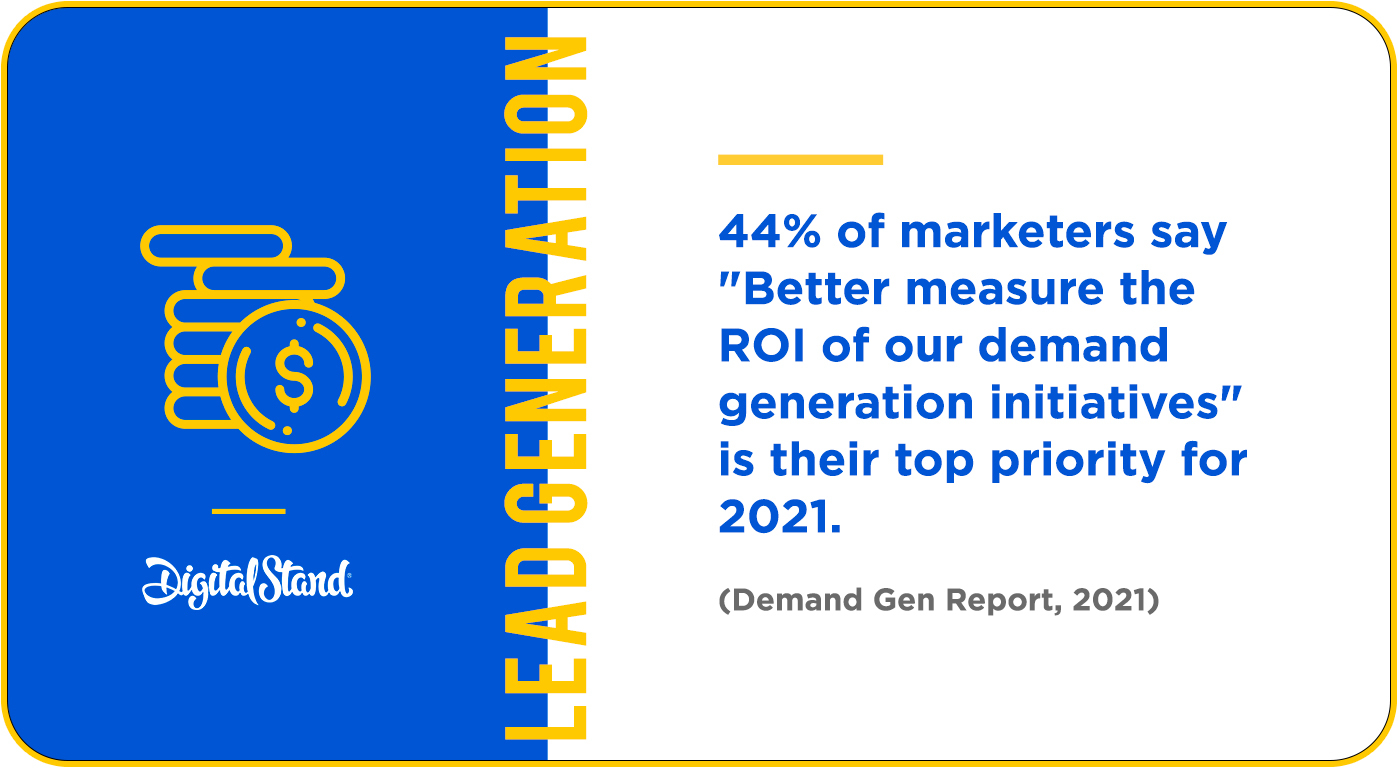
- 44% of marketers say "Better measure the ROI of our demand generation initiatives" is their top priority for 2021. (Demand Gen Report)
- More than half (53%) of marketers say webinars is the top-of-the-funnel format that generates the most high-quality leads. (Demand Gen Report)
- The top priority for marketers is generating leads. (HubSpot)
- 53% of marketers say email has been the most effective channel for early-stage lead generation. (Demand Gen Report)
- In 2021, 78% of marketers say their demand-gen budget will grow or remain the same. (Activate)
- 28% of marketers say using additional account-level fields helps improve their lead scoring. (Activate)
- Ad placement and audience targeting are the top ways that advertisers drive more demand. (Activate)
- Over 60% of marketers said their CAC has increased in the past three years. (HubSpot)
- 49% of companies report that increasing customer acquisition is their primary objective. (Ascend2)
- Just over 75% of marketers are reporting on how their campaigns are directly influencing revenue. (Hubspot)
- Only 35% of marketers said that understanding the ROI of their campaigns is “Very Important” or “Extremely Important.” (Hubspot)
- 52% of marketers are currently using attribution reporting. (Hubspot)
- 91% of marketers are "somewhat confident"’ or "very confident" that they’re investing in programs that influence revenue.
(Hubspot) - 15% of marketers measure the success of their content programs by how many leads they generate. (Hubspot)

- 67% of companies use lead generation as the sole metric to determine content success. (SEMrush)
- 75% of marketers use their reports to show how campaigns are directly impacting revenue. (HubSpot)
- Automation continues to rise with more than 76% of companies using it in some manner (HubSpot)
- Less than 25% of marketers are not reporting how campaigns are impacting revenue. (HubSpot)
- Google Analytics is the top SEO tool used by marketers. (HubSpot)
- Email automation campaigns are among the top three tactics used by email marketers to improve performance. (HubSpot)
- 92% of marketing agencies are investing more time, resources, and budget into marketing automation integration. (MarketingProfs)
- Of those who are automating marketing, 23% are automating their content delivery. (HubSpot)
- 20% of marketers are using automated email marketing campaigns. (HubSpot)
- 68% of businesses use automation in some way. (HubSpot)
- 92% of B2B marketers now have an ABM program, and 68% of them use automation. (Salesforce)
Email Marketing
Since 2013 when I first started Digital Stand, I heard two main catch cries: social media would never achieve an ROI. Finally, enough once it did, I began to hear that email was dead.
According to Campaign Monitor, email marketing has the highest return on investment for small businesses. Just as interesting, though, that marketers who use A/B testing generate returns 37% higher than those who don't.
With the number of email users set to grow to 4.48 billion by 2024 (Statista), email and EDM marketing has a long way to go. However, you should be considering making your EDM's and emails as contextual as possible. You can do this by including videos, segmenting your audience, and personalising to the greatest extent possible.
- 35% of marketers choose to send three to five emails per week to their customers. (HubSpot)
- Promotional emails are the most common email type that marketers are investing in. (HubSpot)
- A study that included 1,000 business owners stated e-mail marketing was the second most effective medium for building brand awareness.(Campaign Monitor)
- The industry average email click-through rate is 2.13%. (GetResponse)
- Hobbies have the highest click rate, at 5.01% (Mailchimp)
- Friday is typically the day with the highest click-through rates potential, at 2.7%. (Campaign Monitor)
- At 30.5% in 2020, government emails dominate email open rates globally. (Campaign Monitor)
- Over 20% of marketers surveyed say that email design is improving their email engagement. (HubSpot)
- Audience segmentation is now one of the top 3 tactics used by marketers. (HubSpot)
- Email subject lines feature 43.85 characters on average. (AWeber)
- Out of 1,000 analyzed emails, only 6.9% incorporated an emoji in the subject line. (AWeber)
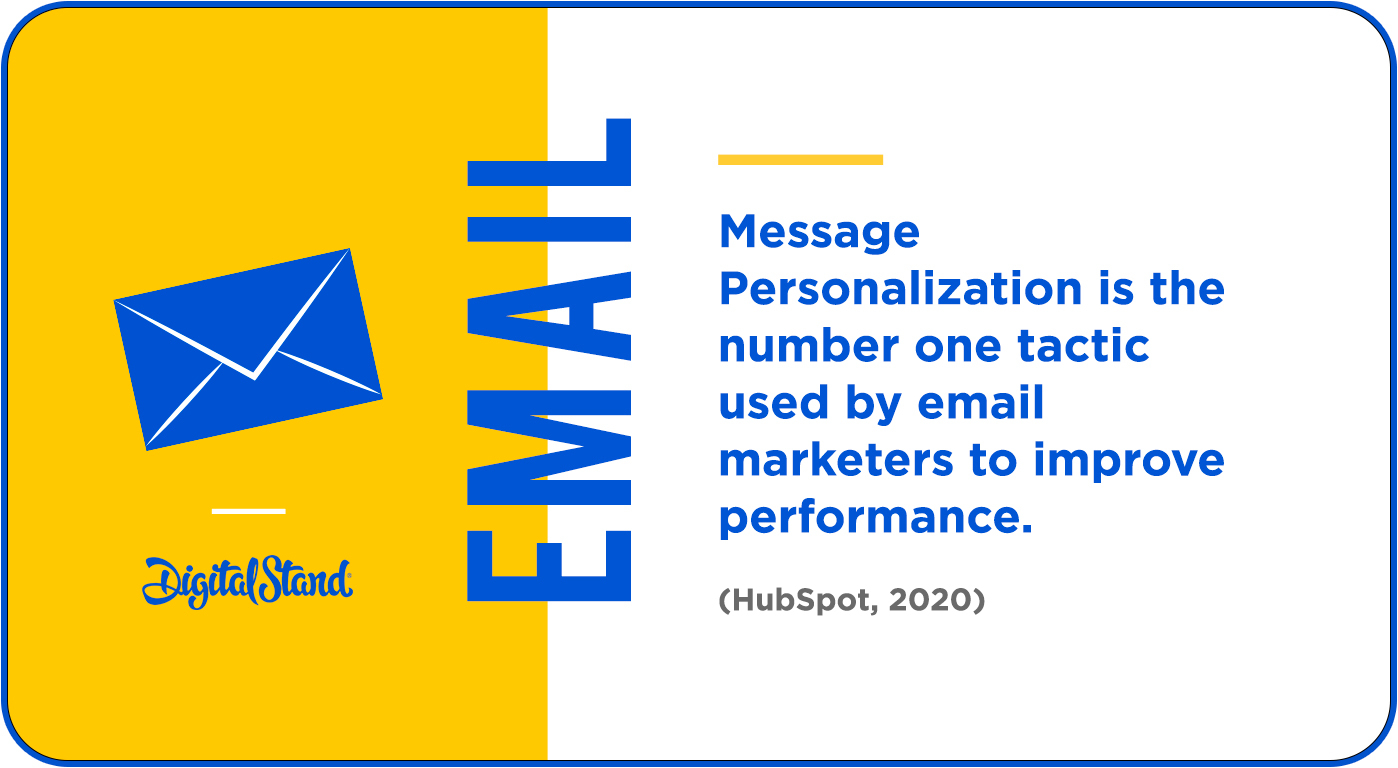
- Message Personalization is the number one tactic used by email marketers to improve performance. (HubSpot, 2020)

- 4.1 billion people are now using email (more than half the worlds population)
- Companies that A/B test every email see email marketing returns that are 37% higher than those of brands that never include A/B tests. (Litmus)
- 64% of small businesses say their email copy is effective or very effective. (AWeber)
- 45% of small businesses with effective or very effective email copy have average open rates of 26% or higher.
(AWeber) - Marketers who use segmented campaigns note as much as a 760% increase in revenue.
(Campaign Monitor) - Almost 30% of marketers surveyed use audience segmentation tactics to improve email engagement.
(HubSpot) - Roughly 80% of marketers have reported an increase in email engagement over the past 12 months.
(HubSpot) - Apple iPhone and Gmail are the most popular clients for opening mobile emails.
(Campaign Monitor) - Mobile accounted for 42% of all email opens in 2019. (Litmus)
- In 2019, the number of global email users amounted to 3.9 billion. (Statista)
- Mobile readers who open emails a second time from their computer are 65% more likely to click through.
(Campaign Monitor) - The number of global email users is set to grow to 4.48 billion users by 2024. (Statista)
- The average email deliverability across all email service providers is 79.6%. (EmailToolTester)
- Mobile-friendly email is the second most-used tactic for email marketers to improve their performance. (HubSpot, 2020)
- Nearly 25% of people who open an email on a mobile device will open it again: 70% will stick with their mobile device, and 30% will go elsewhere. (Campaign Monitor)
- From a study of 1,000 small business owners, email marketing was ranked as the second most effective medium for building brand awareness. (Campaign Monitor)
- Email marketing has the highest return on investment for small businesses. (Campaign Monitor)
- Tuesdays see the highest email open and email unsubscribe rates (Campaign Monitor)
- The number of global e-mail users is set to grow to 4.48 billion users in 2024. (Statista)
- Of all emails opened on mobile devices, 66% are read for more than eight seconds. (Litmus)
- 40% of people 18 years old and under will always open an email on their mobile device first. (Campaign Monitor)
- 40% of consumers say they have at least 50 unread emails in their inbox. (Sinch)
Social Media
In 2020 the number of social media users in the world crossed over the four billion mark! With the average user spending approximately 2.2 hours on their social media platform or platforms of choice.
According to Statista January 2021 report, Facebook is still leading the way with 2.7 billion monthly users. Followed by YouTube, WhatsApp, Facebook Messenger and Instagram.
As a marketer, if I look at that data, it is straightforward for social media that the suite of Facebook platforms could present a significant opportunity for you.
Let us break down the statistics on the following platforms for you.
Social Media
- Facebook, Instagram, and Twitter lead the pack as the most common social media platforms used by marketers.
(HubSpot) - Most marketers agree that Facebook (Meta) is the most popular social media platform across all age groups.(HubSpot)
- In a 2019 survey, 15% of video marketers said they planned to include TikTok in their 2020 video marketing strategy.(Wyzowl)
- Social listening is the number one tactic used by marketers. (HubSpot)
- Increased exposure is the most commonly cited advantage of using social media for marketing purposes among global industry professionals. (Statista)
- Improved traffic, lead generation, and growing fan loyalty are among the top reasons why marketers see value in employing social networks in their campaigns. (Statista)
- The most common publishing cadence for social media marketers is three-to-four times per week. (HubSpot)
- More than half of all businesses (60%) are planning to increase their Instagram budget, and almost half are planning to do the same for Facebook, YouTube, and LinkedIn. (Hootsuite)
- By 2023, the number of social network users in the U.S. is expected to reach 257.4 million. (Statista)
- 73% of all marketers rank "increased acquisition of new customers" as their top outcome for social in 2021.
(Hootsuite) - 66% of marketers say social listening has increased in value for their organization over the past 12 months (Hootsuite)
- 45% of marketers cited "drive conversions" as a key business outcome for social in 2021 (Hootsuite)
- By 2023, the number of social network users in the U.S. is expected to reach 257.4 million. (Statista)
- The number of global social media users is expected to reach almost 3.43 billion in 2023. (Statista)
- Statista projects that close to 800 million Chinese internet users will access social networks in 2023, up from 673.5 million social network users in 2018. (Statista)
- In 2018, social media ad spending reached about $27 billion in the U.S. (including paid social ads, games, and apps).
(Statista) - 15% of video marketers plan to include 360-degree video in their 2020 video marketing strategy.
(Wyzowl) - People are twice as likely to share video content with their friends than any other type of content.
(Wyzowl) - In 2019, 59% of non-video marketers surveyed said they expected to start using video as a marketing tool in 2020.
(Wyzowl)
- As of Q1 2021, there are 2.7 billion monthly active Facebook users. (Statista)
- There are over 280 million Facebook users in India making it the top country in terms of Facebook audience size. (Statista)
- Facebook is the primary content distribution channel for marketers today. (HubSpot)
- There are over 80 million small businesses using Facebook's free business tools. (Facebook)
- Facebook is the primary content distribution channel for marketers today. (HubSpot)
- Over 1.6 billion people around the world are connected to a small business on Facebook. (Facebook)
- 18% of marketers currently use Facebook Groups. (HubSpot)
- Around 43% of U.S. adults get news from Facebook. (Pew Research Center)
- In April 2020, over 98% of Facebook's active user accounts worldwide accessed the social network via any kind of mobile phone. (Statista)
- 79% of video marketers use Facebook as a video marketing channel. (Wyzowl)
- eMarketer predicts that Instagram will reach 1.1 billion users in 2022 (eMarketer)
- As of April 2020, 35% of global Instagram audiences were between the ages of 25 and 34. (Statista)
- Instagram is the social channel with the second-highest ROI among marketers. (Hubspot)
- Over two-thirds of total Instagram audiences are 34-years-old or younger, as of April of 2020. (Statista)
- As of 2019, 69% of social media marketers said they'd increase their use of Instagram in the future. (Statista)
- IGTV, an app for long-form, vertical video on Instagram, allows users to share live video content between 15 and 16 minutes long. (Instagram)
- 28% of video marketers plan to include InstagramTV in their 2020 video marketing strategy. (Wyzowl)
- A 2019 survey found 25% of teens in the U.S. used Instagram the most out of all social networks. (Statista)
- Women accounted for 56.4% of Instagram users in the U.S. as of February 2020. (Statista)
- In 2023, Instagram is projected to reach 120.3 million monthly active users in the U.S., up from 107.2 million users in 2019. (Statista)
- The U.S. is the country with the most Instagram users, reaching 120 million users as of April 2020. India was ranked second and Brazil in third. (Statista, 2020)
- As of March 2020, Cristiano Ronaldo is the most-followed person on Instagram with over 209 million followers. (Statista, 2020)
- In 2018, there were 3.7 million brand-sponsored influencer posts on the social platform (Statista, 2019)
- LinkedIn now has in excess of 774 million users. (Statista 2021)
- According to a 2020 survey, 43% of LinkedIn's audience members were female and 57% were male.
(Statista) - In 2019, LinkedIn InMail was the third most-used candidate outreach channel globally, behind email and phone/ text. (Statista)
- In 2019, over 87% of video marketers on LinkedIn described the platform as an effective video marketing channel. (Wyzowl)
- 66% of video marketers in a 2019 survey said they would include LinkedIn in their 2020 video marketing strategy. (Wyzowl)
- LinkedIn is the second-most popular social media platform used by B2B marketers, ranking only behind Facebook. (Statista, 2019)
- Pinterest now has 459 million users globally (Pinterest 2021)
- As of Q1 2020, Pinterest had 367 million monthly active users worldwide. (Statista)
- The number of Pinterest users in the U.S. is expected to reach 90.1 million. (Statista)
- During a survey, 25% of responding social media marketers at B2B companies stated they used Pinterest to market their businesses. (Statista)
- In February 2017 there was a total of 250 million searches performed using Pinterest Lens, while in February 2018, there was a 140% increase, with a total amount of 600 million visual searches. (Statista)
- 85% of users have bought something based on Pins they see from brands (Pinterest)
- Women are around 60% of Pinterest's total users (Pinterest 2021)
Snapchat
- Of Snapchat's $1.79 billion global revenue in 2019, $1.07 billion came from North America. (Statista)
- In 2019, Snapchat was the most important social network for 44% of U.S. teens. (Statista)
- As of Q1 2021, Snapchat had 265 million daily active users globally, up from 218 million in Q1 2021. (Orbelo)
- In the U.S., Snapchat has an estimated 46 million monthly active users. (Statista)
- As of Q3 2019, 53% of U.S. internet users between the ages of 15 and 25 use Snapchat. (Statista)
- Snapchat users now spend over 30 minutes a day on the platform (Snapchat)
- Snapchat offers six different advertisement formats on the platform. (Statista)
- In 2018, 39.9% of social network users in the U.S. used Snapchat to communicate but this share is projected to decline to 35.3% by 2023. (Statista)
- As of April 2020, the U.S. had the biggest Snapchat user base in the world, with an audience of almost 103 million users. India ranked in second place with a Snapchat audience base of 28.2 million users.
(Statista) - The majority of Snapchat visits by users are generated via mobile phones. (Statista)
- According to a survey during Q3 2019, 48% of Snapchat users in the U.S.shared content to the social platform on a weekly basis. (Statista)
TikTok
- In 2019, TikTok was the third most downloaded non-gaming app in the world with over 1.5 billion downloads. (Statista)
- In 2019, TikTok had approximately 37.2 million users in the U.S. (Statista)
- Almost a quarter of online U.S. adults say they have come across videos posted on TikTok. (Statista)
- Social video app TikTok from ByteDance has been downloaded more than 2 billion times globally on the App Store and Google Play (Sensor Tower)
YouTube
- YouTube is the second highest visited platform in the world (HubSpot)
- YouTube was the social media platform with the biggest reach among U.S. Gen Z and Millennial internet users in 2019, regardless of gender. (Statista)
- 83% of video marketers that have used YouTube said it had been successful for them. (Wyzowl)
- Viewers say they’re 2x more likely to buy something they saw on YouTube. (Google)
- YouTube has become the number 1 platform social media marketers build communities on (YouTube)
- By using Google Ads, Schmidt Naturals saw a 48% uptick in brand awareness for its vegan products on YouTube. (Google)
- The company Purple saw a 34.6% boost in brand consideration for their mattress orders by using Google Ads audience targeting on YouTube. (Google)
- Over 2 billion logged-in users visit YouTube each month and every day people watch over a billion hours of video and generate billions of views. (YouTube)
- YouTube, on mobile alone, reaches more people in the 18-34 U.S. audience demographic than any TV network. (YouTube)
- Twitter ranks number 12 in the most visited websites in the world (SEMrush)
- The number of global daily active users on Twitter is 166 million. (Statista)
- Twitter is among the top three social channels used by marketers with the highest ROI. (Statista)
- Twitter's annual revenues reached almost $3.46 billion as of 2019. (Statista)
- Globally, the U.S. is the country with the most Twitter users, followed by Japan and Russia. (Statista)
- Twitter generated 87% of its revenue through advertising services in 2019. (Statista)
- The largest U.S. Twitter audience by age group, as of September 2018, is tied between 25-34 and 55-64 year-olds.
(Statista) - As of January 2020, 43.8% of U.S. Twitter audiences were female and 56.2% were male. (Statista)
- 38% of video marketers plan to include Twitter in their 2020 video marketing strategy. (Wyzowl)
Video Marketing
64% of businesses have now stated that in the last 12 months, a video on Facebook has resulted in a new client.
Another 84% of people now say that they've been convinced to buy a product or service by watching the brands video.
There is no question that video marketing is on the rise; in terms of content, brands are starting to publish more videos than blog posts. The remarkable aspect of video marketing is that you can get a feel for the company in far greater depth than you've ever been able to.
But video marketing and the benefits associated with this new media is not only for generating leads and or new customers, but he's also having a significant impact on service and staff training.
Another 95% of marketers say they have a greater understanding of their product based on using video to explain their offering. Should you have reluctance in using video to promote your business, instead, think about using video as a service tool. 43% of marketers now say video has reduced the number of support calls they receive.
Not only can video impact revenue generation, but it can also have a significant impact on cost reduction. It is making this form of communication unparalleled when it comes to client acquisition and client education.
- 75% of shoppers say they have used a Google product (Search, Maps, YouTube) in the past week to help with their shopping. (Think with Google)
- 64% of businesses said in the last 12 months, a video on Facebook resulted in a new client. (Animoto)
- 83% of video marketers say video has helped them generate leads. (Wyzowl)
- 84% of people say that they’ve been convinced to buy a product or service by watching a brand’s video.
(Wyzowl)
- 95% of video marketers said they felt they’d increased understanding of their product or service using video.
(Wyzowl) - 43% of video marketers say video has reduced the number of support calls they’ve received. (Wyzowl)
- 93% of brands got a new customer because of a video on social media. (Wyzowl)
- 96% of marketers have placed ad spend on video. (Wyzowl)
- In 2020, social engagement videos are among the top four most common types of video marketers are investing in today.
(HubSpot) - The most common types of videos made by marketers are presentations (65%), followed by ads (57%), and explainers (47%). (Biteable)
- Video is the second most-used content type on social media used to increase audience engagement. (HubSpot)
- 88% of video marketers say they plan to use YouTube in 2020. (Wyzowl)
- Live video is the third most-used social media marketing tactic. (HubSpot)
- In terms of the most popular YouTube brand channels (ranked by the number of video views), toymaker LEGO was ranked first with 10.04 billion views in February 2020. (Statista)
- YouTube and Facebook are the most widely used platforms among video marketers — used by 85% and 79%, respectively.
(Wyzowl) - Only 11% of video marketers say they've used Snapchat as a video channel in 2020. (Wyzowl)
- People are 1.5x more likely to watch video daily on a smartphone than on a computer. (Facebook)
- 93% of brands got a new customer because of a video on social media. (Wyzowl)
- 92% of video marketers feel the levels of noise and competition have increased in the last year. (Wyzowl)
- When people are deciding what video to watch on YouTube, relating to their passions is 3X more important than whether or not the video has a famous actor, and 1.6X more important than whether the video has high production quality.
(Think with Google) - 99% of people who use video for marketing say they’ll continue using video in 2020. (Wyzowl)
- YouTube is the fourth most-used social media platform by marketers (Facebook, Instagram, and Twitter topped the list).
(HubSpot) - 88% of video marketers reported that video gives them a positive ROI. (Wyzowl)
- The average length of the top trending videos of the year was over 9.5X longer in 2019 than in 2010.
(YouTube) - 75% of shoppers say they have used a Google product (Search, Maps, YouTube) in the past week to help with their shopping. (Think with Google)
Think About This
As I stated at the outset statistics, tell a story! As marketers and business leaders, we must be able to not only look at the data within those statistics and determine its benefit. We must ask ourselves what is it what is the hidden message.
Where are there gaps in the market, and are there opportunities to exploit those gaps? Is it through A/B testing landing pages or A/B testing EDM campaigns? Should we be writing articles of greater than 3000 words? Should we ensure our targeting and ad placement is second to none using data to determine their needs and influence creativity?
In both digital and offline advertising, you see 10,000 ads per day. Yes, that's right, 10,000 ads per day! In a short attention world as marketers and business leaders, it is our responsibility to use every strategy and tactic to communicate our message.
Because if we're genuinely selling something that helps the consumer and or business leader solve real problems? Our responsibility is to ensure we're doing the best possible job to make sure our message breaks through the noise.
As the statistics show above, taking many of the above actions will improve your ability for the message to be heard, and you will be in rare air. You are competing where others are not prepared to go and differentiating your brand by your efforts.
After all, isn't that our job?
Feel free to download on Whitepaper below or reach out start a conversation with us. We are always interested in talking to brands that want to achieve more, do more and be more!

.jpeg?width=200&height=200&name=pexels-mikhail-nilov-6893349%20(1).jpeg)


